v2.6 [Jan 18, 2017]
- New Five new Yield-Density models added (thanks Charles Tomkins for the model list), and previous Yield Density models have been moved to the Yield-Spacing family.
- New: changed the strategy for the "Top Results" plot. It now always displays only the top results (the number of which is configurable in the application preferences). Previously, the plot would always add the top results from any new calculations the user might perform, which was confusing.
- New: When right clicking a result, there is a new menu option "Add to New Plot" when appropriate. This creates a new plot and sends the result(s) there in one step. When a plot is created in this way, the title of the plot is that of the first result sent to it (for example, "Modified Exponential"). The "Add to Plot" option in the menu has been renamed to "Add to Current Plot" also.
- New: Expand/Collapse buttons added in the Nonlinear Regression selection dialog, so that it is easier to select just a couple of families from the library.
- New: Better robustness for 15 of the nonlinear regression models, so that the initial guess mechanism may be able to survive a zero in the x or y columns of the dataset.
- Fixed: If the residual history had a NaN, the Convergence tab would not appear properly (with a small white box) in the result details dialog.
- Fixed: in some situations, obviously failed models were showing with a status of OK.
v2.3 [Feb 6, 2016]
May include unspecified updates, enhancements, or bug fixes.
v2.0 [Jun 16, 2013]
- Changed: Sped up file I/O significantly as long as locale-aware conversions are not used. Files read 4-6 times faster.
- Resolved: intermittent "list index out of range" error when setting axis labels via a hotlinked file.
- Resolved: In the German locale, the graph properties dialog would not respond to OK or Apply.
- Resolved: cloning an image that was in the background did not work correctly.
v1.6 [Jul 10, 2012]
- RESOLVED: Neither the pan nor zoom buttons worked for 3D plots.
v1.5 [Dec 8, 2011]
compatibility release for 64 bit operating systems; the installer has been completely rewritten to accommodate this.
documentation system has been written using HTML help, which is the standard for Vista installations.
various improvements made in the documentation
installation procedure modified to better accommodate network installations and non-admin installations
settings such as preferences and user models are now stored on a per-user basis instead of globally; this is also a bug fix for non-admin users attempting to save user models.
graph preview animation has now been enabled by default.

Iis a program to maximize and optimize the capability of the Syncmaster monitor.
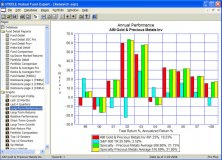
It is an easy-to-use investement program for selection, tracking and analysis.